"Facts are stubborn things. But statistics are pliable"
-Mark Twain
This blog is about statistical bias in machine learning models. But unlike most of what you read on this topic, I’m going to argue that bias can be a good thing – or at least a useful thing – when properly applied.
"Bias can be a good thing – or at least a useful thing – when properly applied."
But first, a little context. I'm the co-founder of Reality AI, a machine learning company acquired by Renesas that specializes in the automatic generation of machine learning models from sensor data – in particular, sensor data that takes the form of high sample rate signals. I'm talking about things like sound, vibration, accelerometers, electrical waveforms (current/voltage), RF, radar… basically, anything that you would think of as a waveform.
Our customers are R&D engineers who are building devices, components or equipment and use our software to solve specific engineering challenges for various types of sensors. No matter if they are processing data on edge hardware or in the cloud. We deal with data about the physical world, not with data about people per se, so the kinds of biases I'm talking about here are statistical, not social.
Good Bias, Bad Bias
The worst kinds of statistical biases, of course, are the ones you don't know about. These are deceptively easy to introduce – through unbalanced data collection, loose protocols for labeling, unmanaged exposure to hidden variables, and careless hardware construction. These biases are unequivocally bad – they can only make your machine learning algorithms less accurate, and they lead you to make poor predictions or decisions.
"The worst kinds of biases are the ones you don't know about."
But some biases – again, I'm talking about bias in a technical, statistical sense – can be very helpful. For example, machine learning classification models generally tend to exhibit a bias towards higher accuracy in classes that are over-represented in training data.
So if you're building that kind of model and you want to make sure that some classes are particularly accurate, you care less about the other ones, then collect more data on the classes you care most about, less on the others. Since data collection is generally the most time-consuming and costly part of a machine learning project, you can take advantage of that bias to help optimize your collection costs – an important, real-world benefit.
Hiding Under a ROC
Another example of an extremely useful statistical bias can be found in deliberately tuning a model (a.k.a. deliberately introducing bias) to reduce false positives at the cost of more false negatives (or vice versa).
There are lots of cases where this is desirable. For example, if your model is used for quality control on a production line, and you want to make absolutely positively sure that you never miss a defect, but don't mind inspecting a few more examples only and find that they were good all along. Or, say, if the conditions you are trying to detect have safety implications, you may have very strong opinions about what it is ok or not-ok to be wrong about.
So how do you do this? Meet the ROC curve.
ROC curves describe the tradeoffs in a model between True Positive accuracy and the rate of False Positives (or said another way, the tradeoff between "recall" and "precision"). For an excellent tutorial that goes more in-depth on the topic, take a look at this article from the excellent Towards Data Science channel on Medium. The quick version goes something like this:
Imagine a perfect 2-class model that always gets things right, 100% of the time. The distribution of probabilities of one class vs. the other looks like:
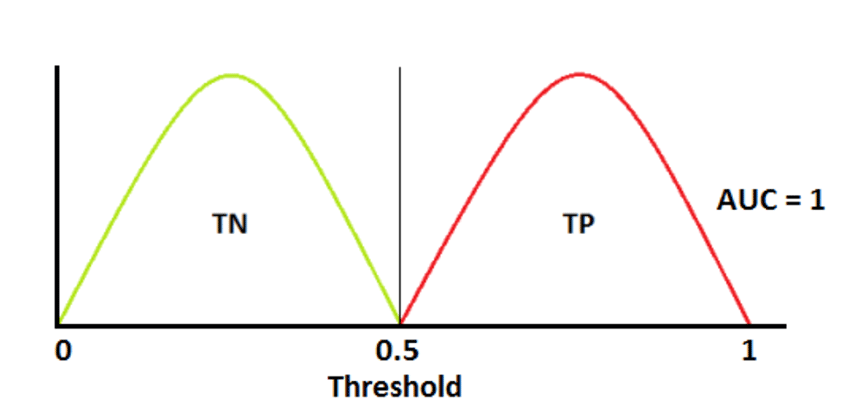
If you were to plot the tradeoff between the true positive rate and the false positive rate… Well, there isn't any tradeoff at all. This model gets things right all the time. So the ROC curve looks like:
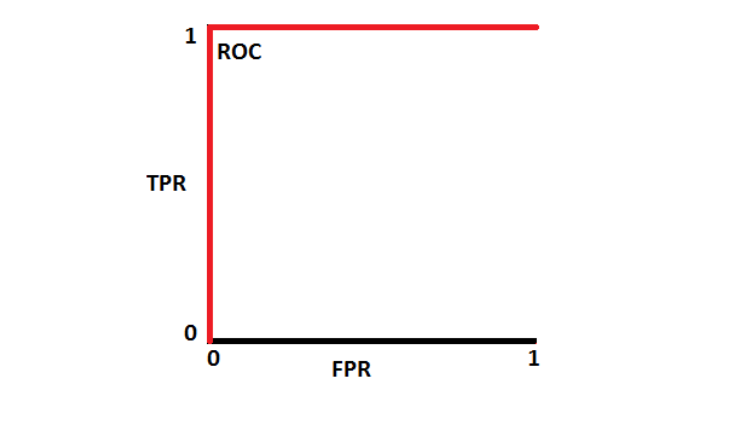
The area under the curve is at its maximum, therefore so is our accuracy.
Now suppose your model isn't perfect, and the probability distributions overlap a bit:
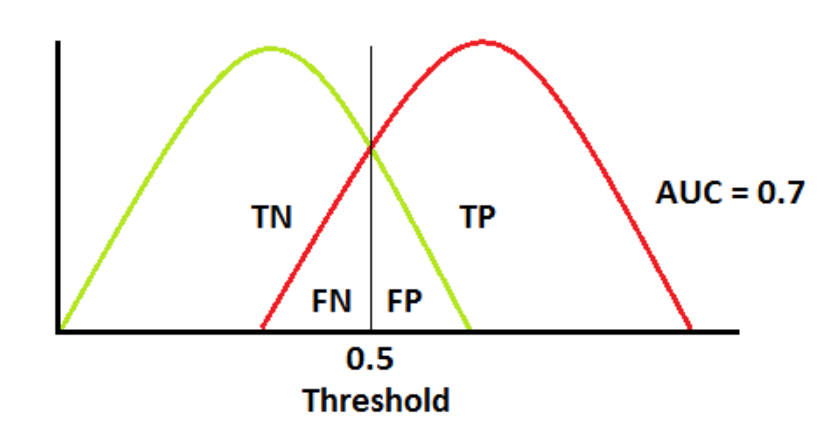
Where you set that threshold now makes a difference. By moving it up or down (right or left on the above graph), you can influence the rate of false positives or false negatives – but always with a tradeoff! There is less area under the curve, and the ROC curve now looks like this:
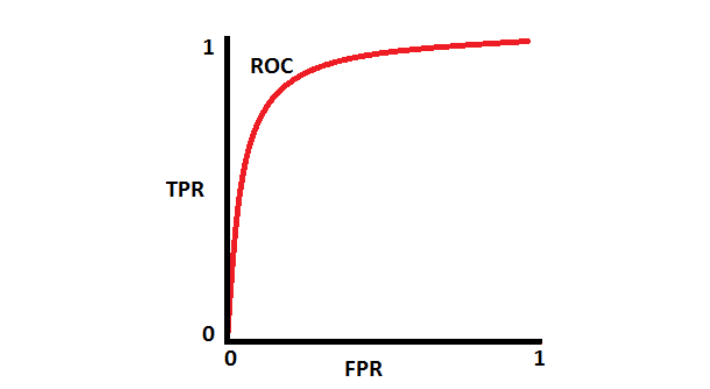
By moving the threshold up or down that curve, you can introduce a bias toward/away from false positives or false negatives, but always at a cost of more of the other.
In our Reality AI software, we implement this by setting the probability threshold at the closest point on the ROC curve to the upper left corner — the point of maximum area under the curve and therefore maximum overall accuracy. But we now allow users to adjust that probability threshold and deliberately bias the model if that makes sense for their use case.
Here's what that looks like in Reality AI:

One big caution though: Before tweaking bias using the ROC curve, first make sure you've done everything you can to improve the overall accuracy of your model. You'll always do better by making that ROC less curvy and more square than you will by sliding around the curve. Save the bias tweaking for a final tuning step.
Bias Isn't Always Bad
So, bias isn't always a bad thing – so long as you recognize it, understand the effect it has, and manage it. Hmm. Maybe there's something to be said there about social biases too…
